Case Study · Lumo · 2024
Revolutionizing Agricultural Irrigation with IoT Technology
SUMMARY
I led product design for an IoT irrigation platform helping wine country growers manage water remotely. I designed Maps — a geolocated valve dashboard — and Smart Baseline, a feature that teaches the system what normal flow looks like block by block, while establishing a design system, setting up design operations and supporting marketing and branding.
DURATION
1 year
COMPANY TYPE
Start Up
ROLE
Lead Product Designer
SECTOR
Ag Tech
01Context & Problem
Agriculture consumes 70% of the world’s freshwater, a vital resource that is becoming more and more insecure. Currently, systems for managing and tracking irrigation are outdated and wasteful. Turning valves on and off manually occupies a large amount of labor resources. Farm workers walk the fields searching for leaks, usually only after they have become so bad that someone noticed. Data around water usage is scarce or too general making it difficult for farmers to make strategic decisions, especially in very specific sectors like the wine industry.
02The Solution
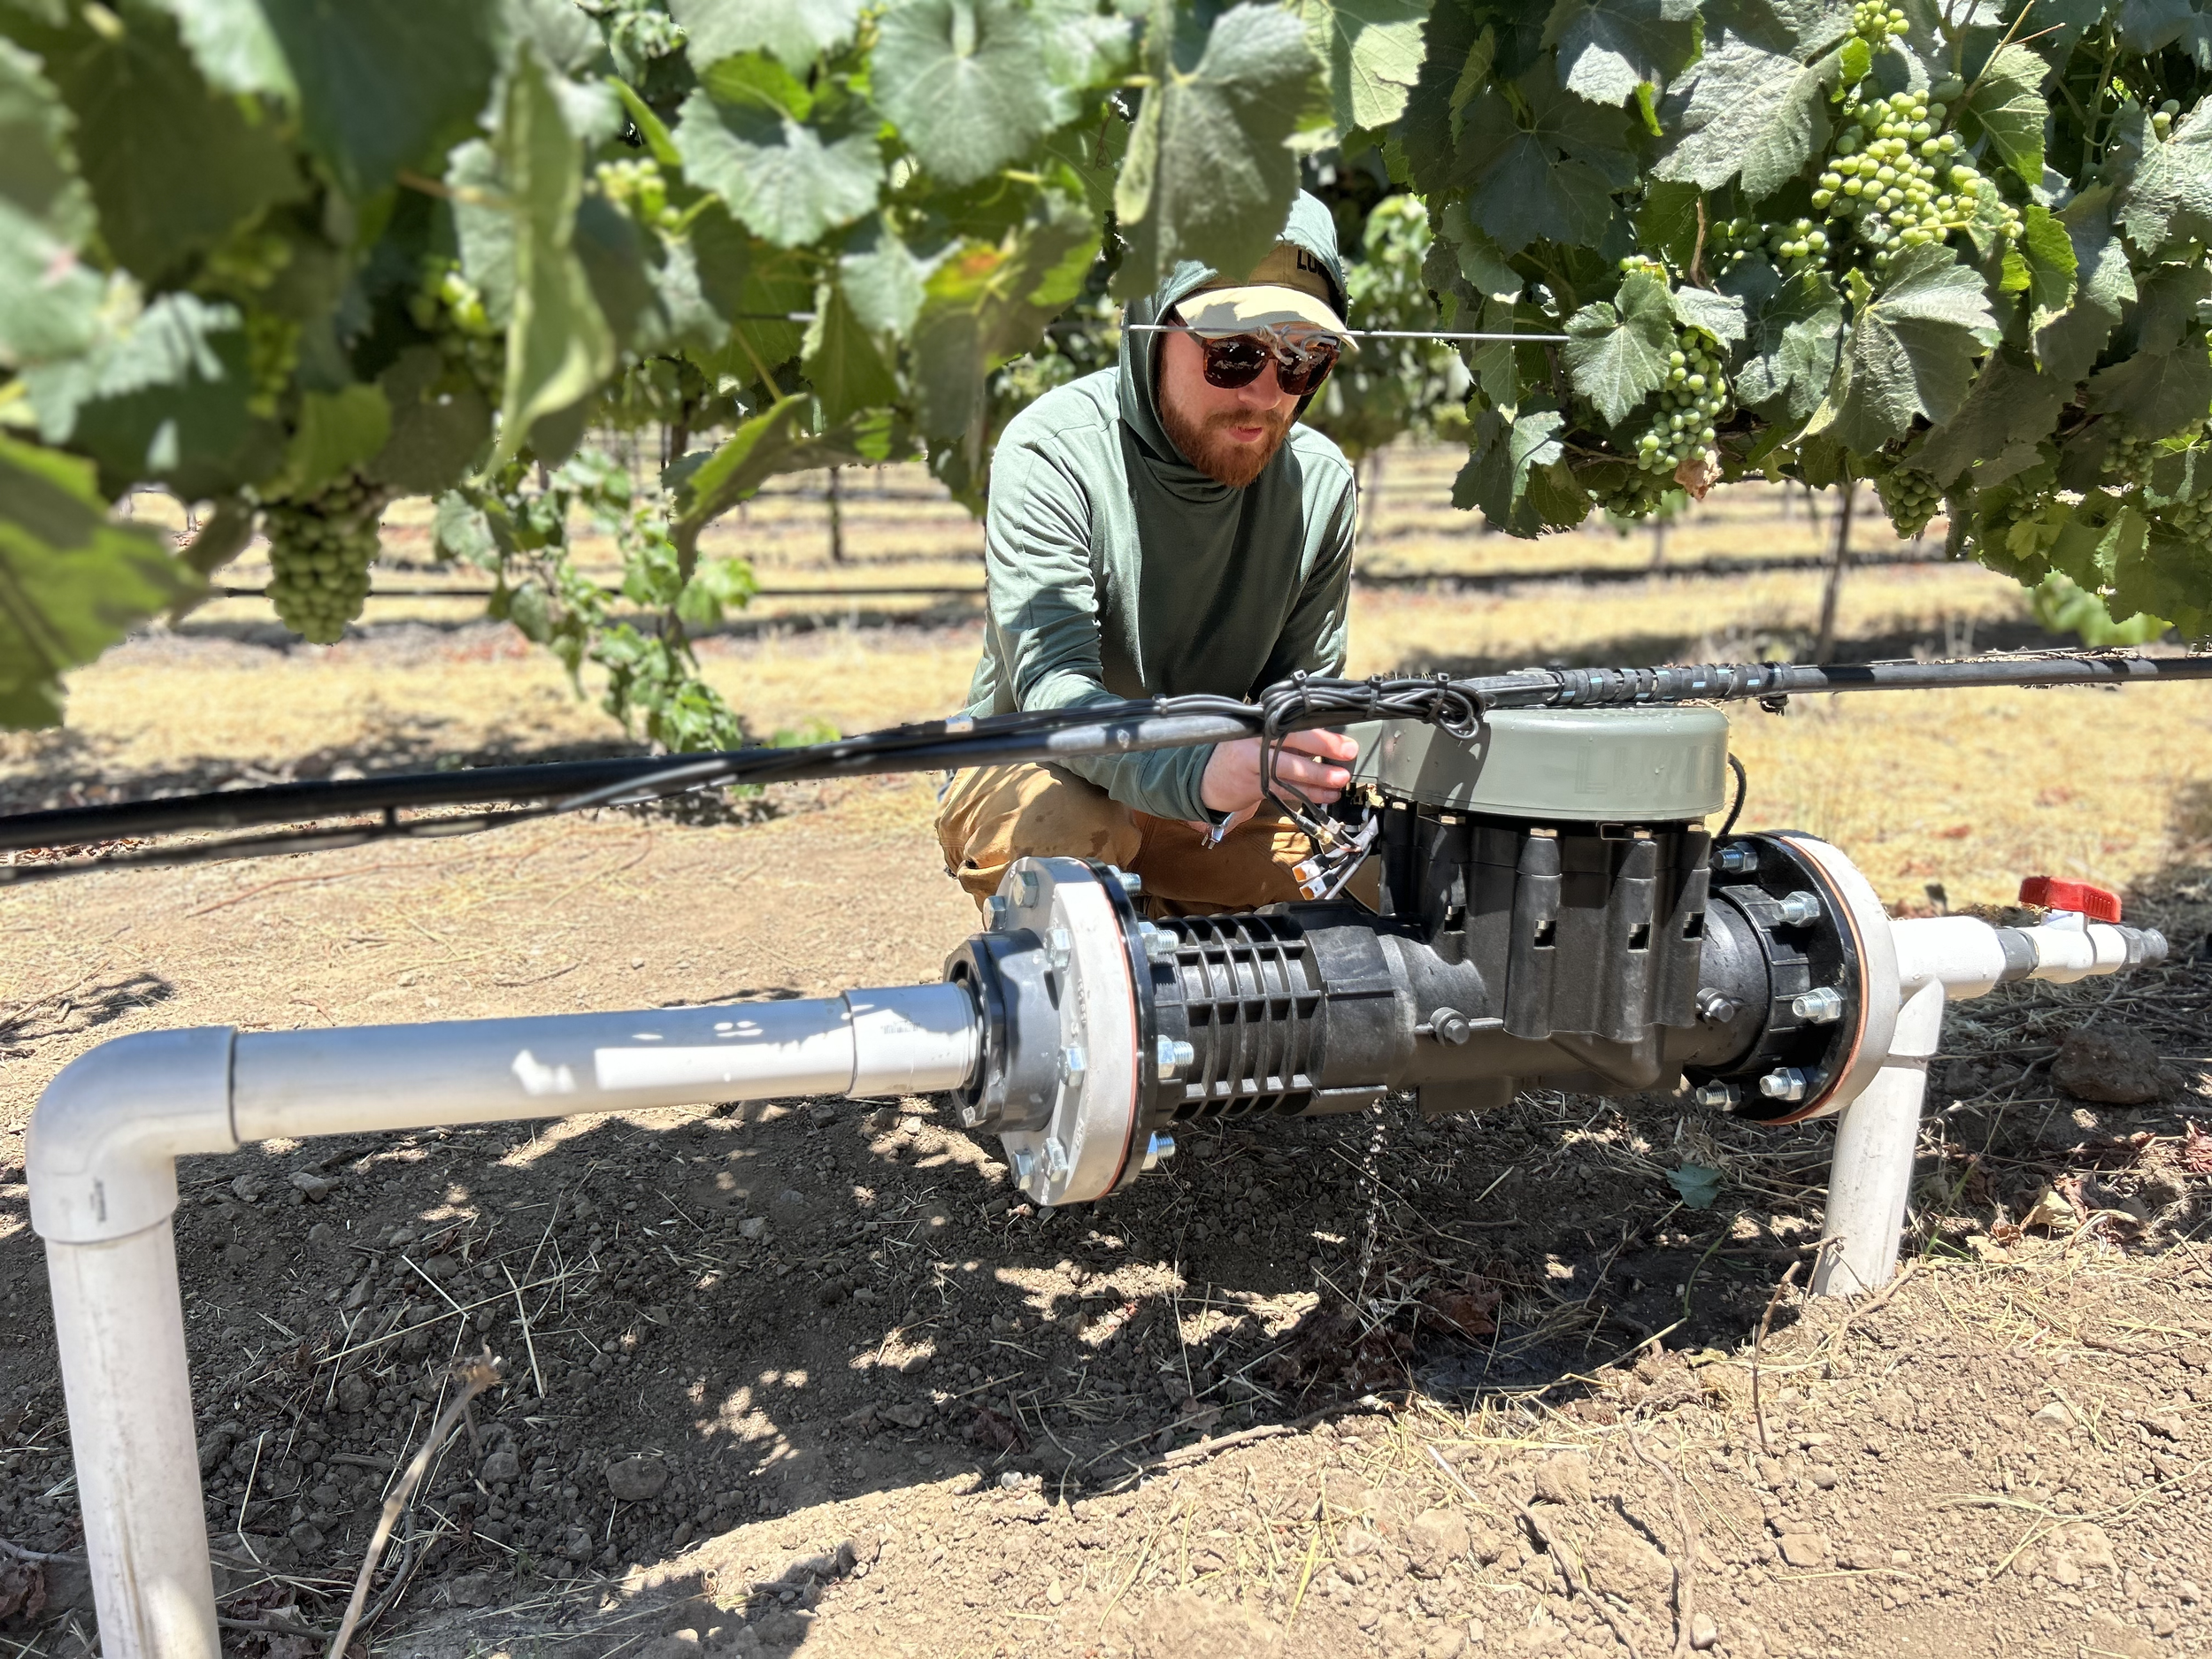
What if there was a way that farmers could track water usage, monitor for leaks and automate irrigations from their office or mobile phone? Lumo developed just that; a simple but revolutionary SmartValve that growers can install throughout their fields, operate remotely and gather data for immediate action or future strategic planning.
I led end to end product design across the Ops Center — Lumo's web-based irrigation management platform — including discovery, UX flows, UI, in-context guidance, and user testing. I will focus on two features that transformed how growers interact with their fields: Maps and Smart Baseline.
Maps
Multiple valves can be installed in different field sections (called blocks). Blocks can be named, but even for the most familiar farmer, remembering which block and valve is where can be difficult. Lumo’s goal is to use technology to optimizes productivity and profitability, while radically reducing the amount of freshwater used in agriculture.
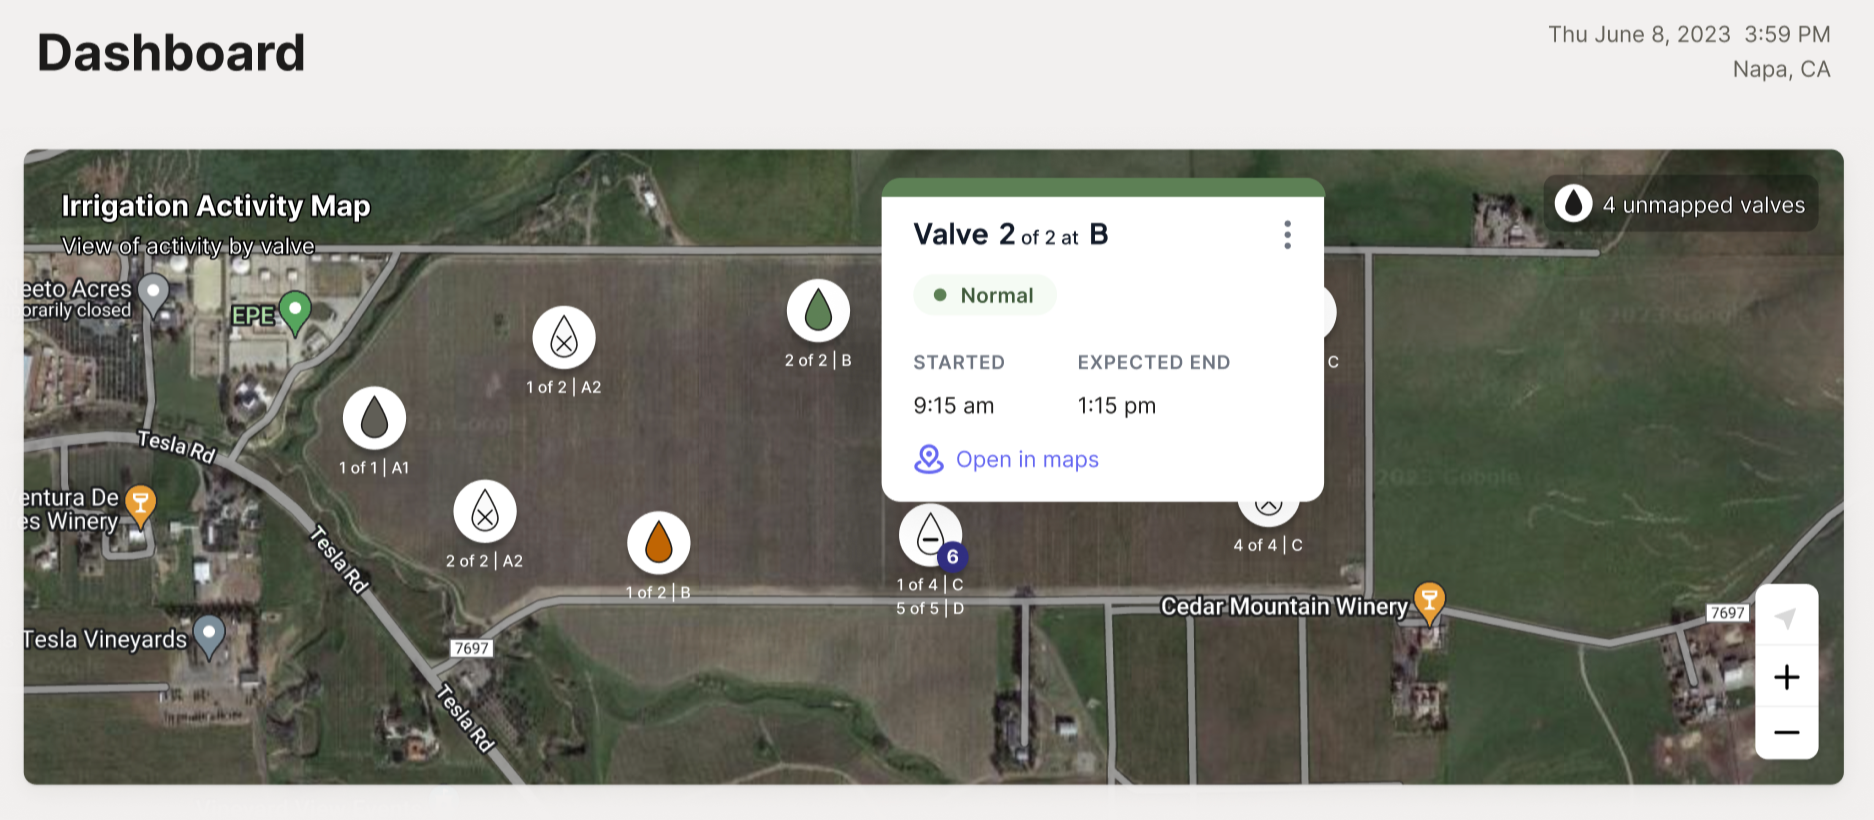
Adding the maps feature to the dashboard allows farmers to see where their blocks and valves are located, what their irrigation status is, and even get directions to the exact valve location. I created a valve component with several variants to denote irregular, normal, manual and inactive irrigations, as well as patterns for multiple valves located at the same location. The feature was tested throughout the design process and very well received among clients upon release.
Smart Baseline
Even with real-time flow monitoring, Lumo's leak detection relied on theoretical calculations — emitter counts, rates, vines per row — data that is often incomplete or simply wrong. Blocks with outdated metadata generated constant false alarms. Growers stopped paying attention, and real problems got missed.
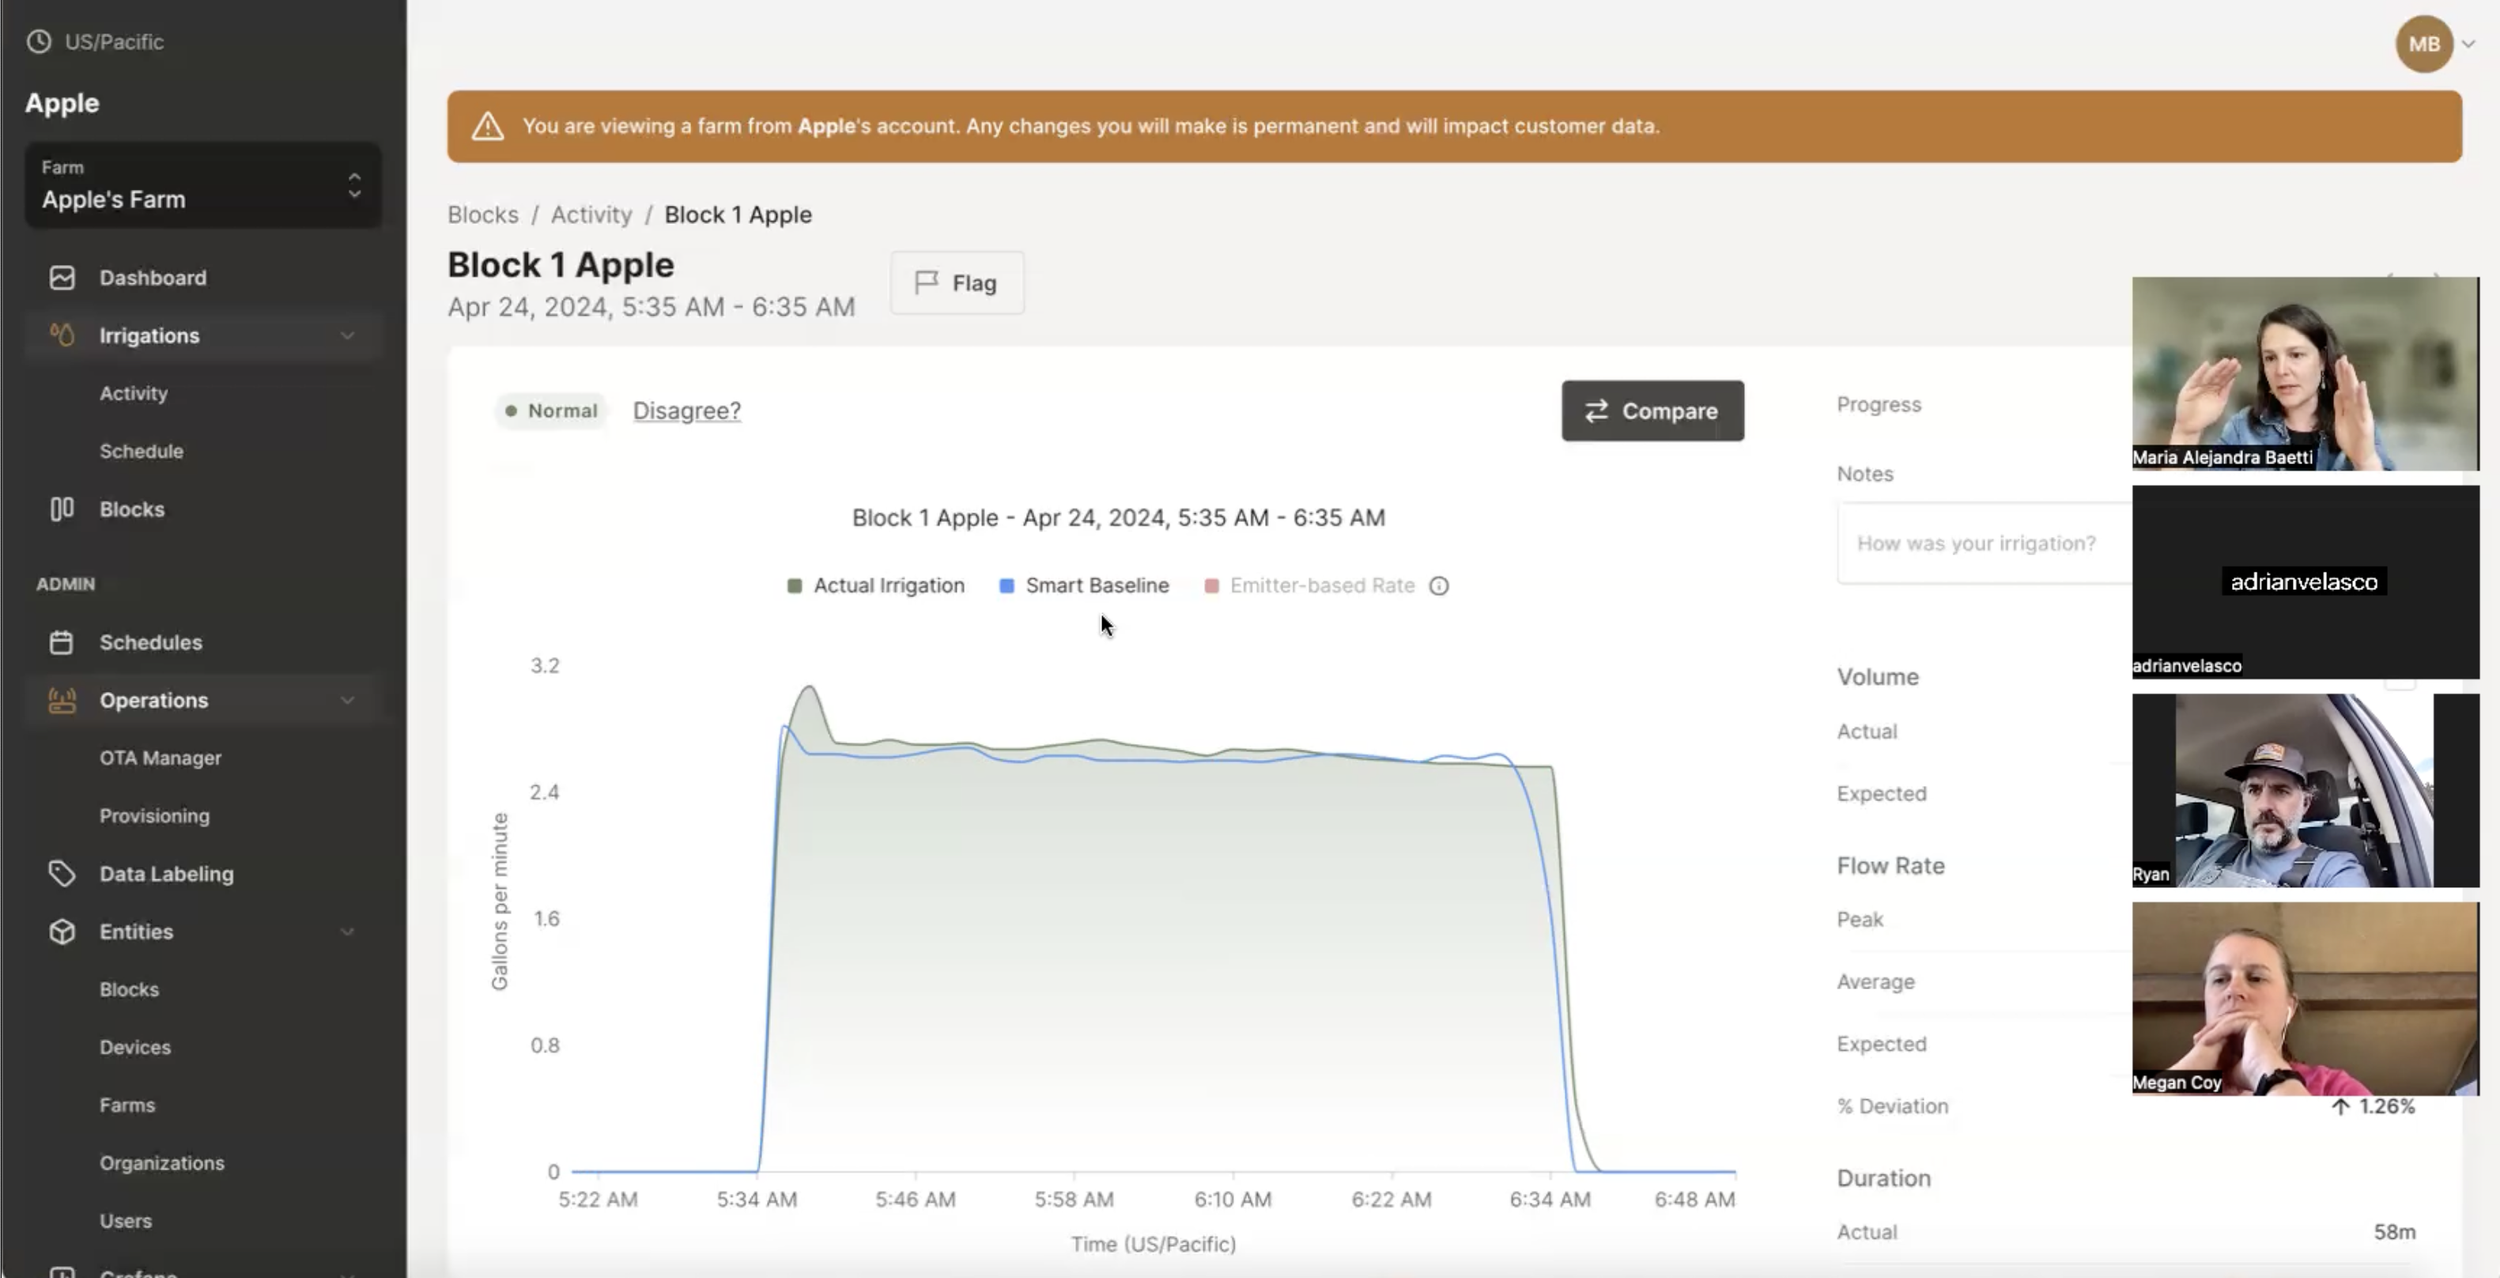
Smart Baseline solves this by letting each block learn what normal actually looks like from real irrigations. The system stays out of the way when everything is running smoothly. When something does need attention, the dashboard surfaces only those blocks — and growers can correct the system with a note when the alert doesn't match reality. Over time, predictions for scheduling and leak detection become grounded in how that specific block actually performs, not a spreadsheet.
03Research
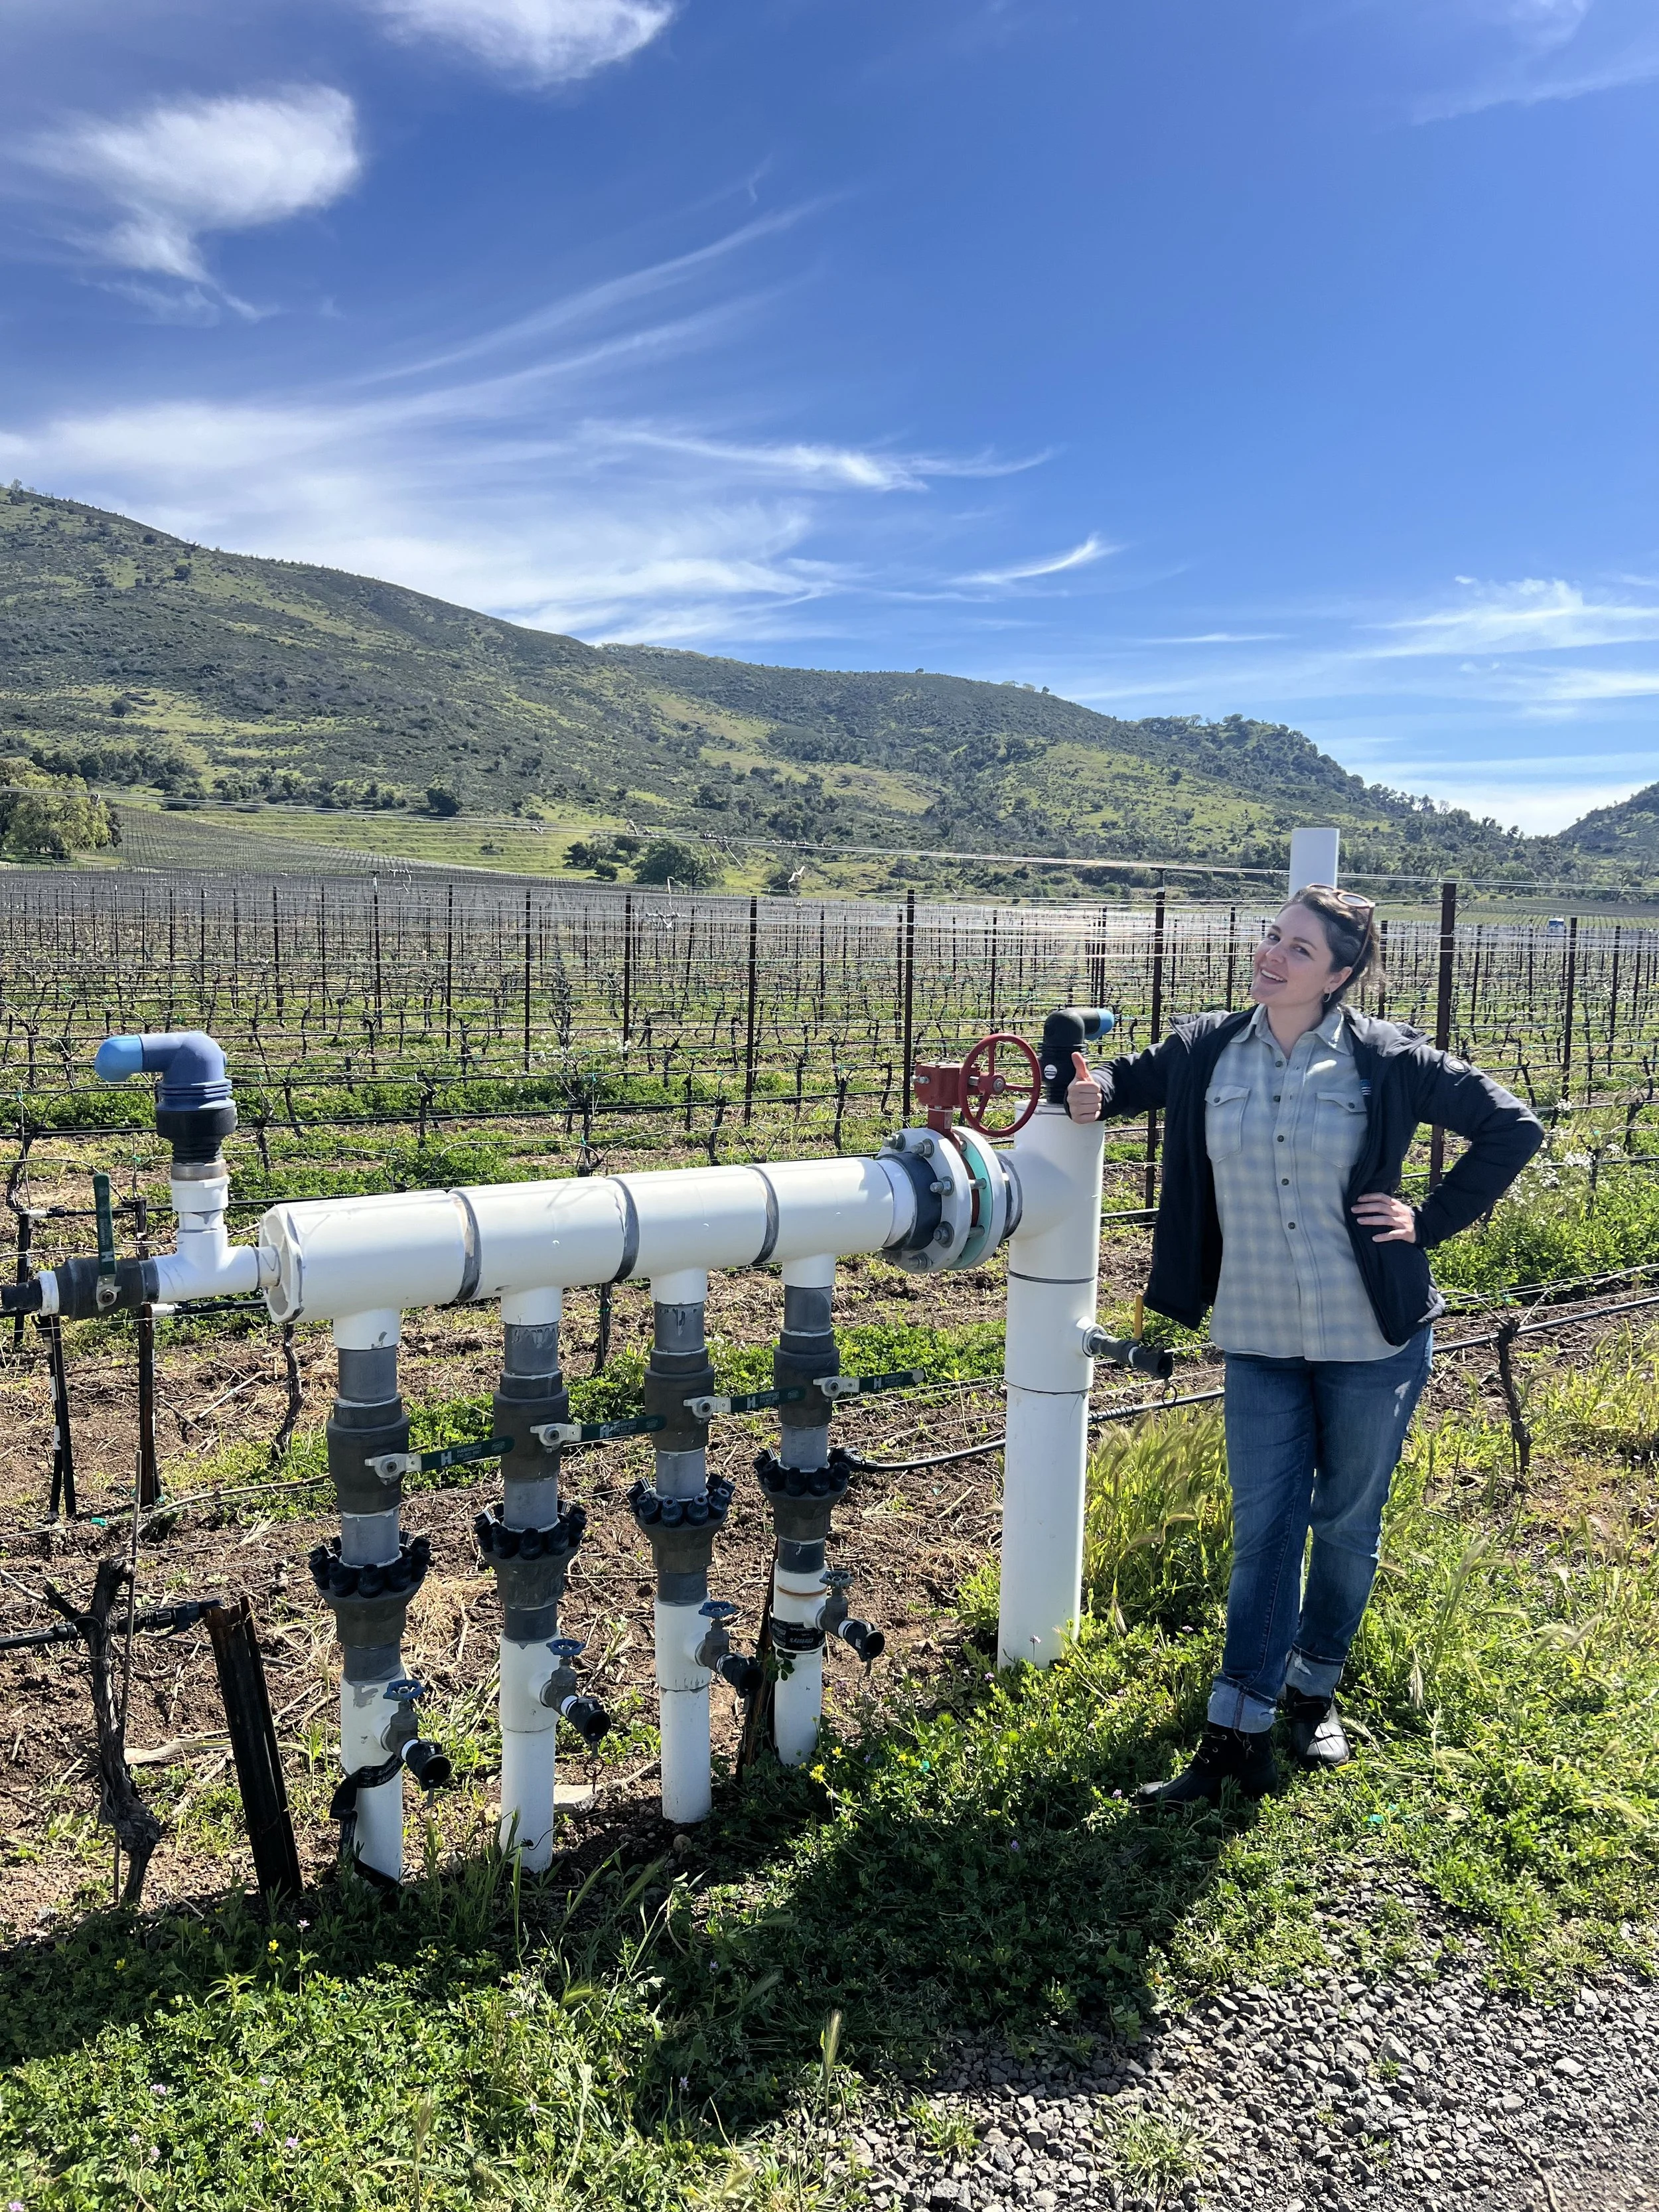
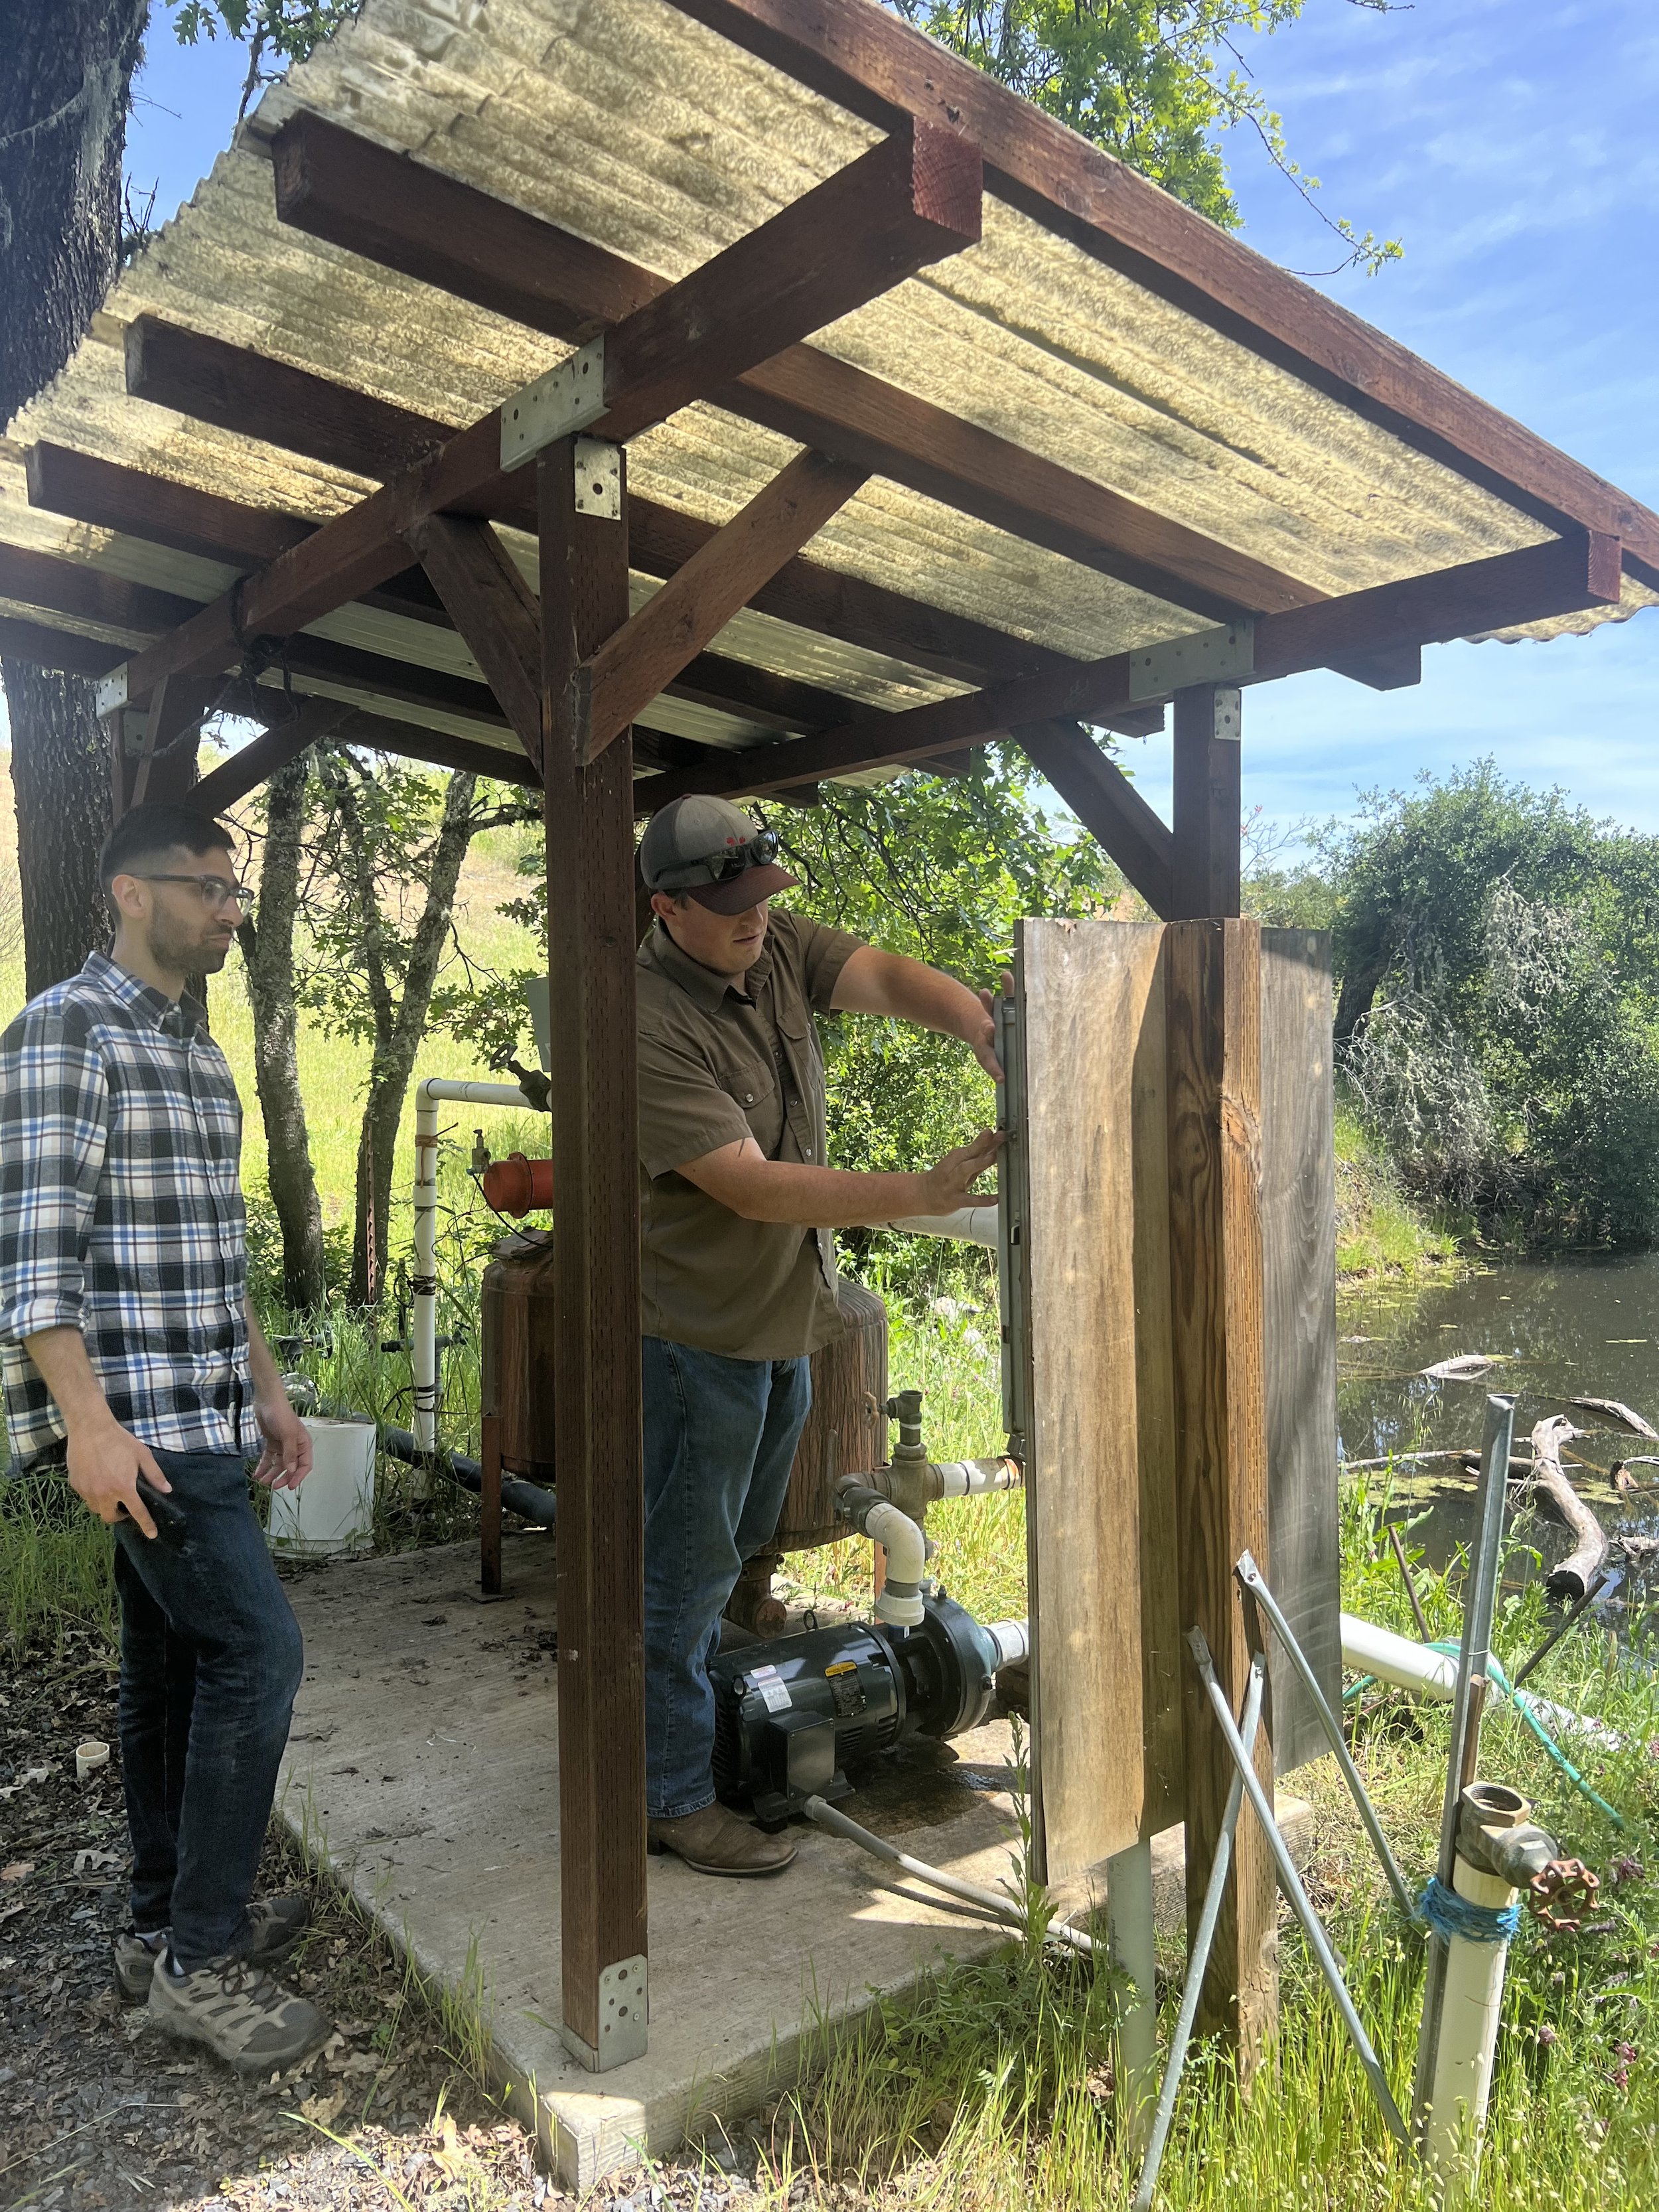
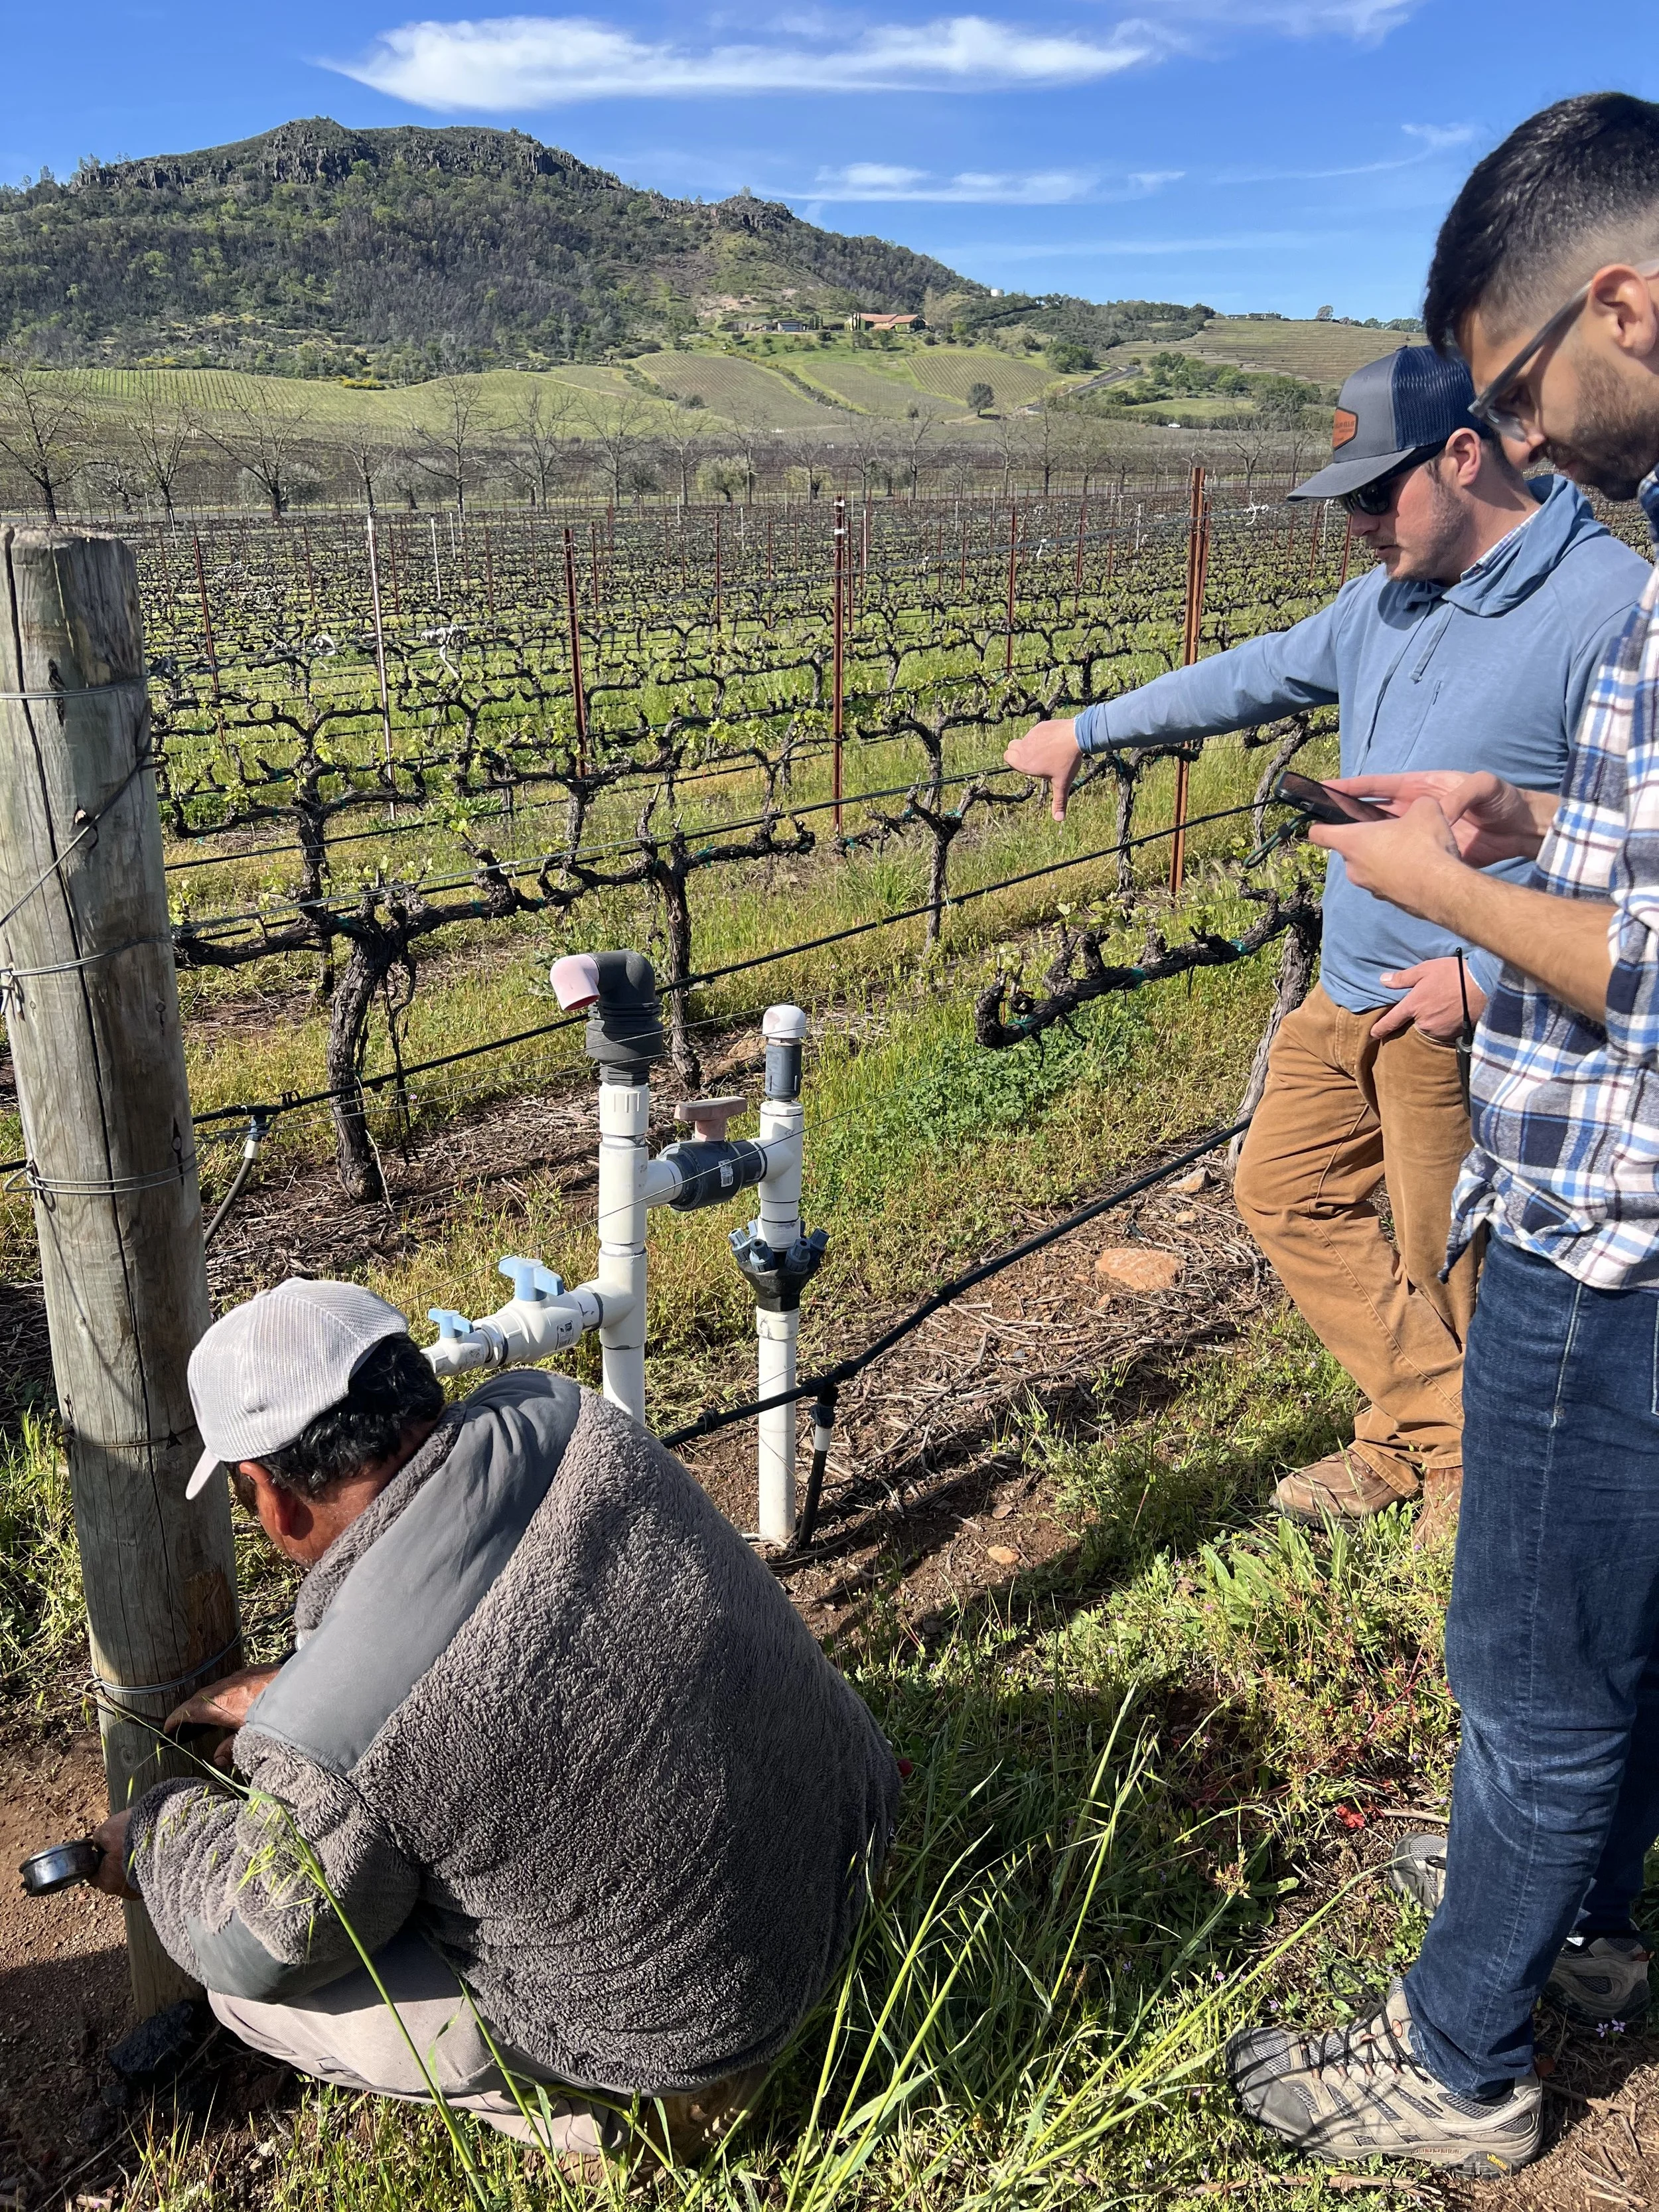
Everything designed and built at Lumo was based on real conversations with real farmers. LUMO is focused geographically on Napa and Sonoma Valley vineyards and headquartered in Santa Rosa, but the team was spread out across Canada, Argentina and various US cities. This meant that the content of those conversations often came in through Confluence docs, Figma comments, Slack messages, Zoom recordings and planned and spontaneous meetings when schedules aligned. The times when I got to travel onsite and spend time in the field shadowing farm workers and interviewing vineyard managers were some of the best brainstorming sessions, pain point discovery moments and opportunities to validate assumptions.
04Competitive Analysis
As a start-up pioneering new technology, there was not a lot of direct competition to analyze in terms of the exact features and functionalities of our tools. However, we always kept an eye on other irrigation tools and listened for information from customers and potential customers about what they liked and disliked about other providers. One of our differentiators was a focus on good UX and clean, simple design that made it easier for farm workers to see what they needed to see, on the go and dig in deeper in the office if needed.

05Early Concepts & User Feedback
Showing my work directly to the end user throughout the design process was key for working in a sector that I had little familiarity with when I started. It was through a user feedback session via Zoom that I opted to go with the satellite image map on the right rather than the stripped down grey version on the left: farmers use landmarks such as trees, sheds, fences and more to help orient them so the satellite view was much more useful.
The same applied to Smart Baseline. Grower feedback rarely arrived in a single meeting — it came through PM summaries, annotated screenshots, and Zoom or in person user feedback sessions. That feedback loop shaped core decisions: keep the Smart Baseline feature invisible until needed, make the "disagree and teach" flow feel like a conversation rather than a settings panel, and write guidance copy that respects how busy growers actually are.
06Impact
Maps — Well received by clients upon release; satellite view validated through grower feedback as the more practical orientation tool in the field
Smart Baseline — Reduced false-alarm fatigue on blocks with inaccurate metadata; growers understood the feature as low-effort, high-trust calibration
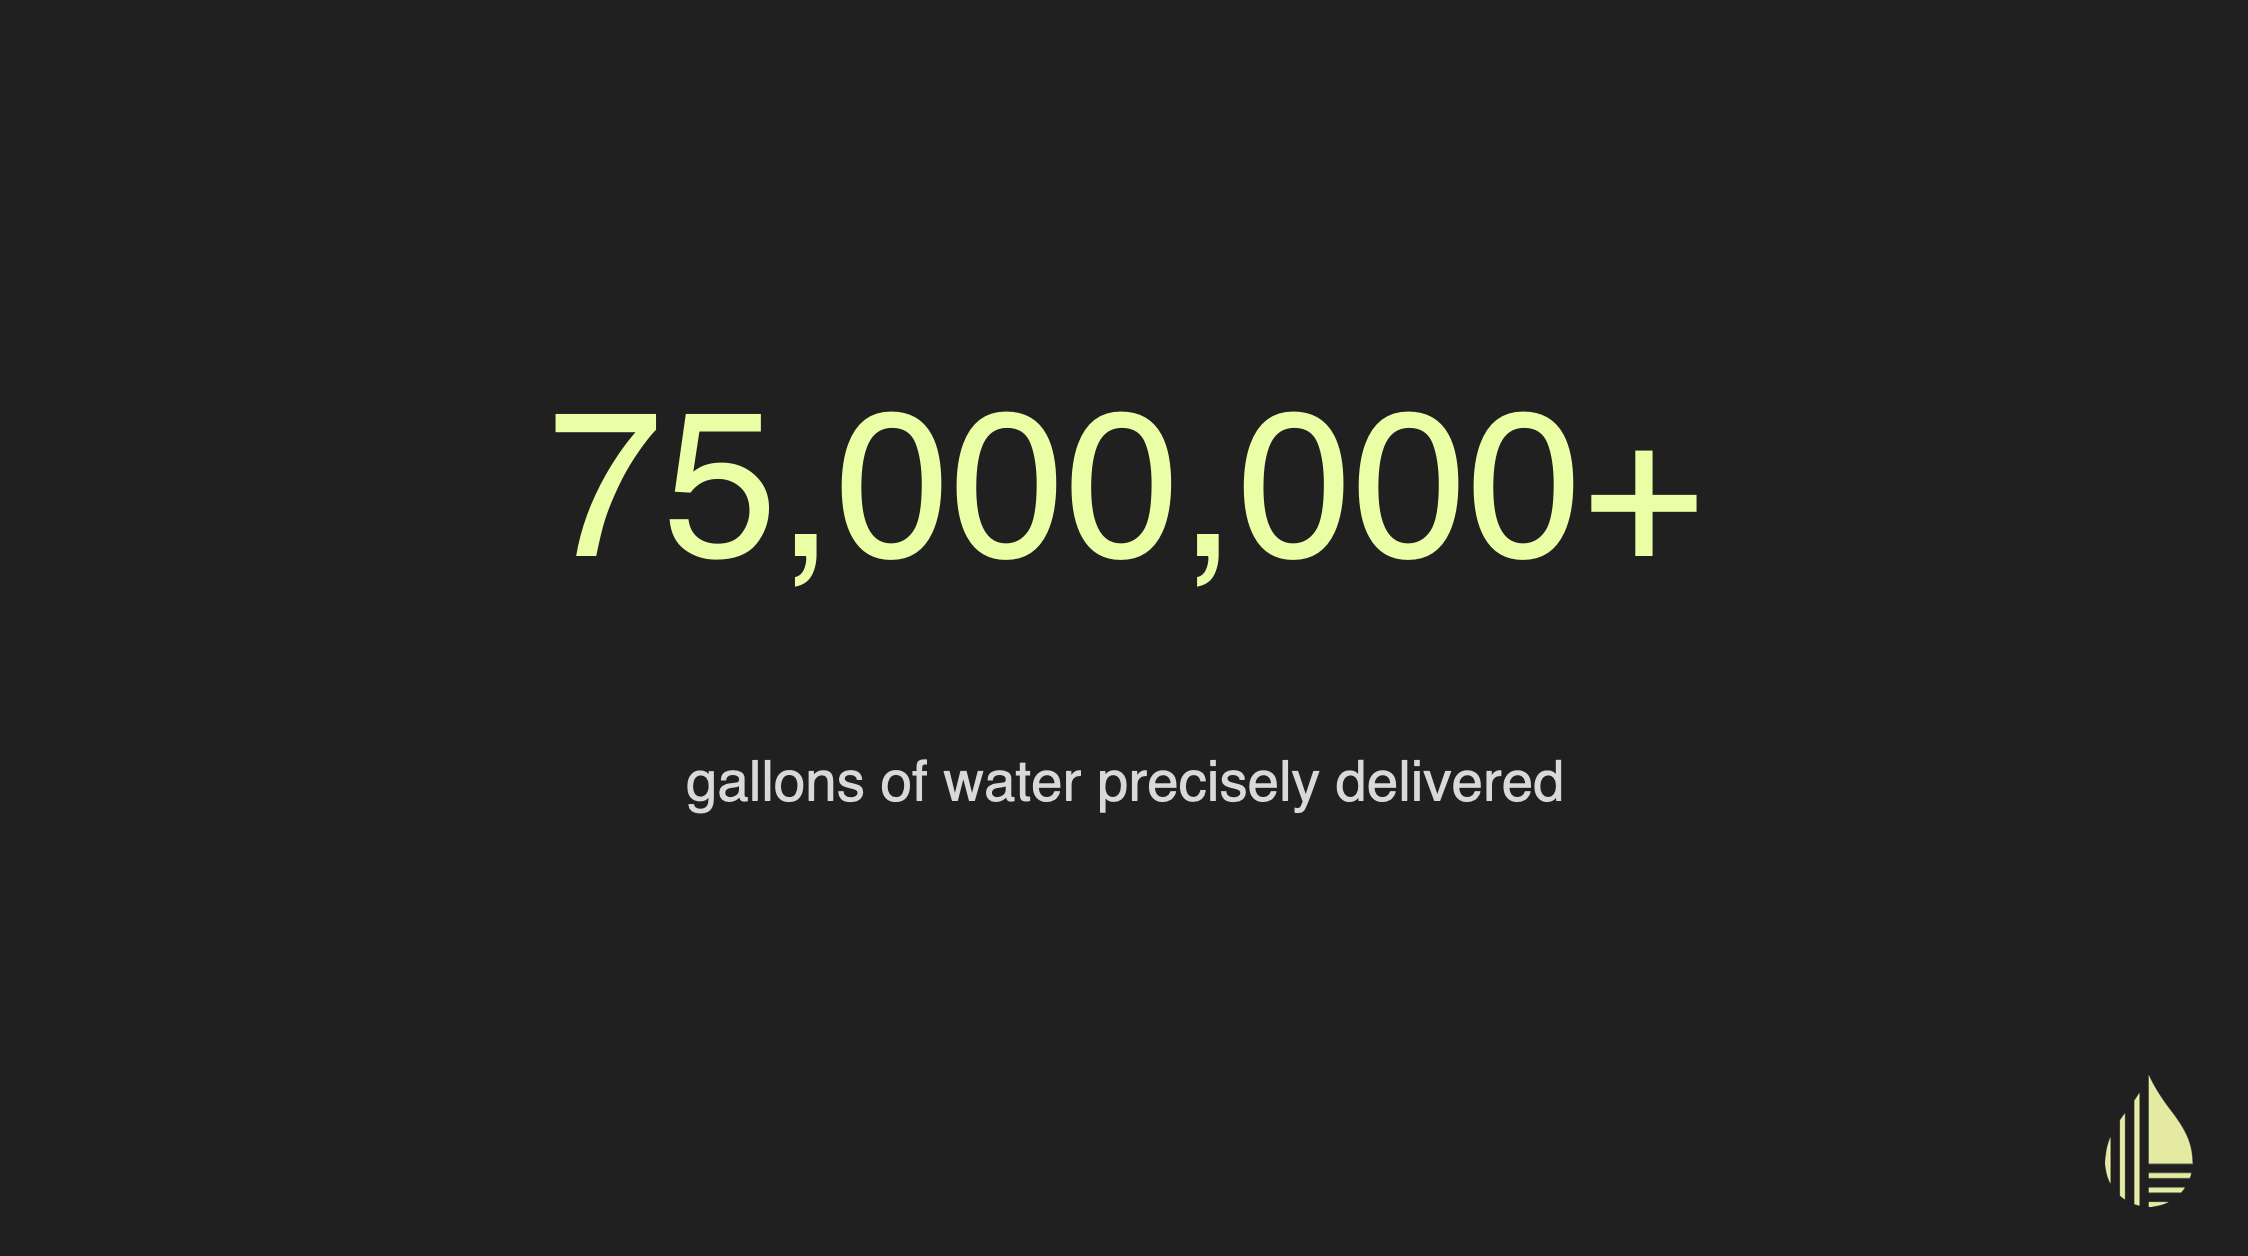
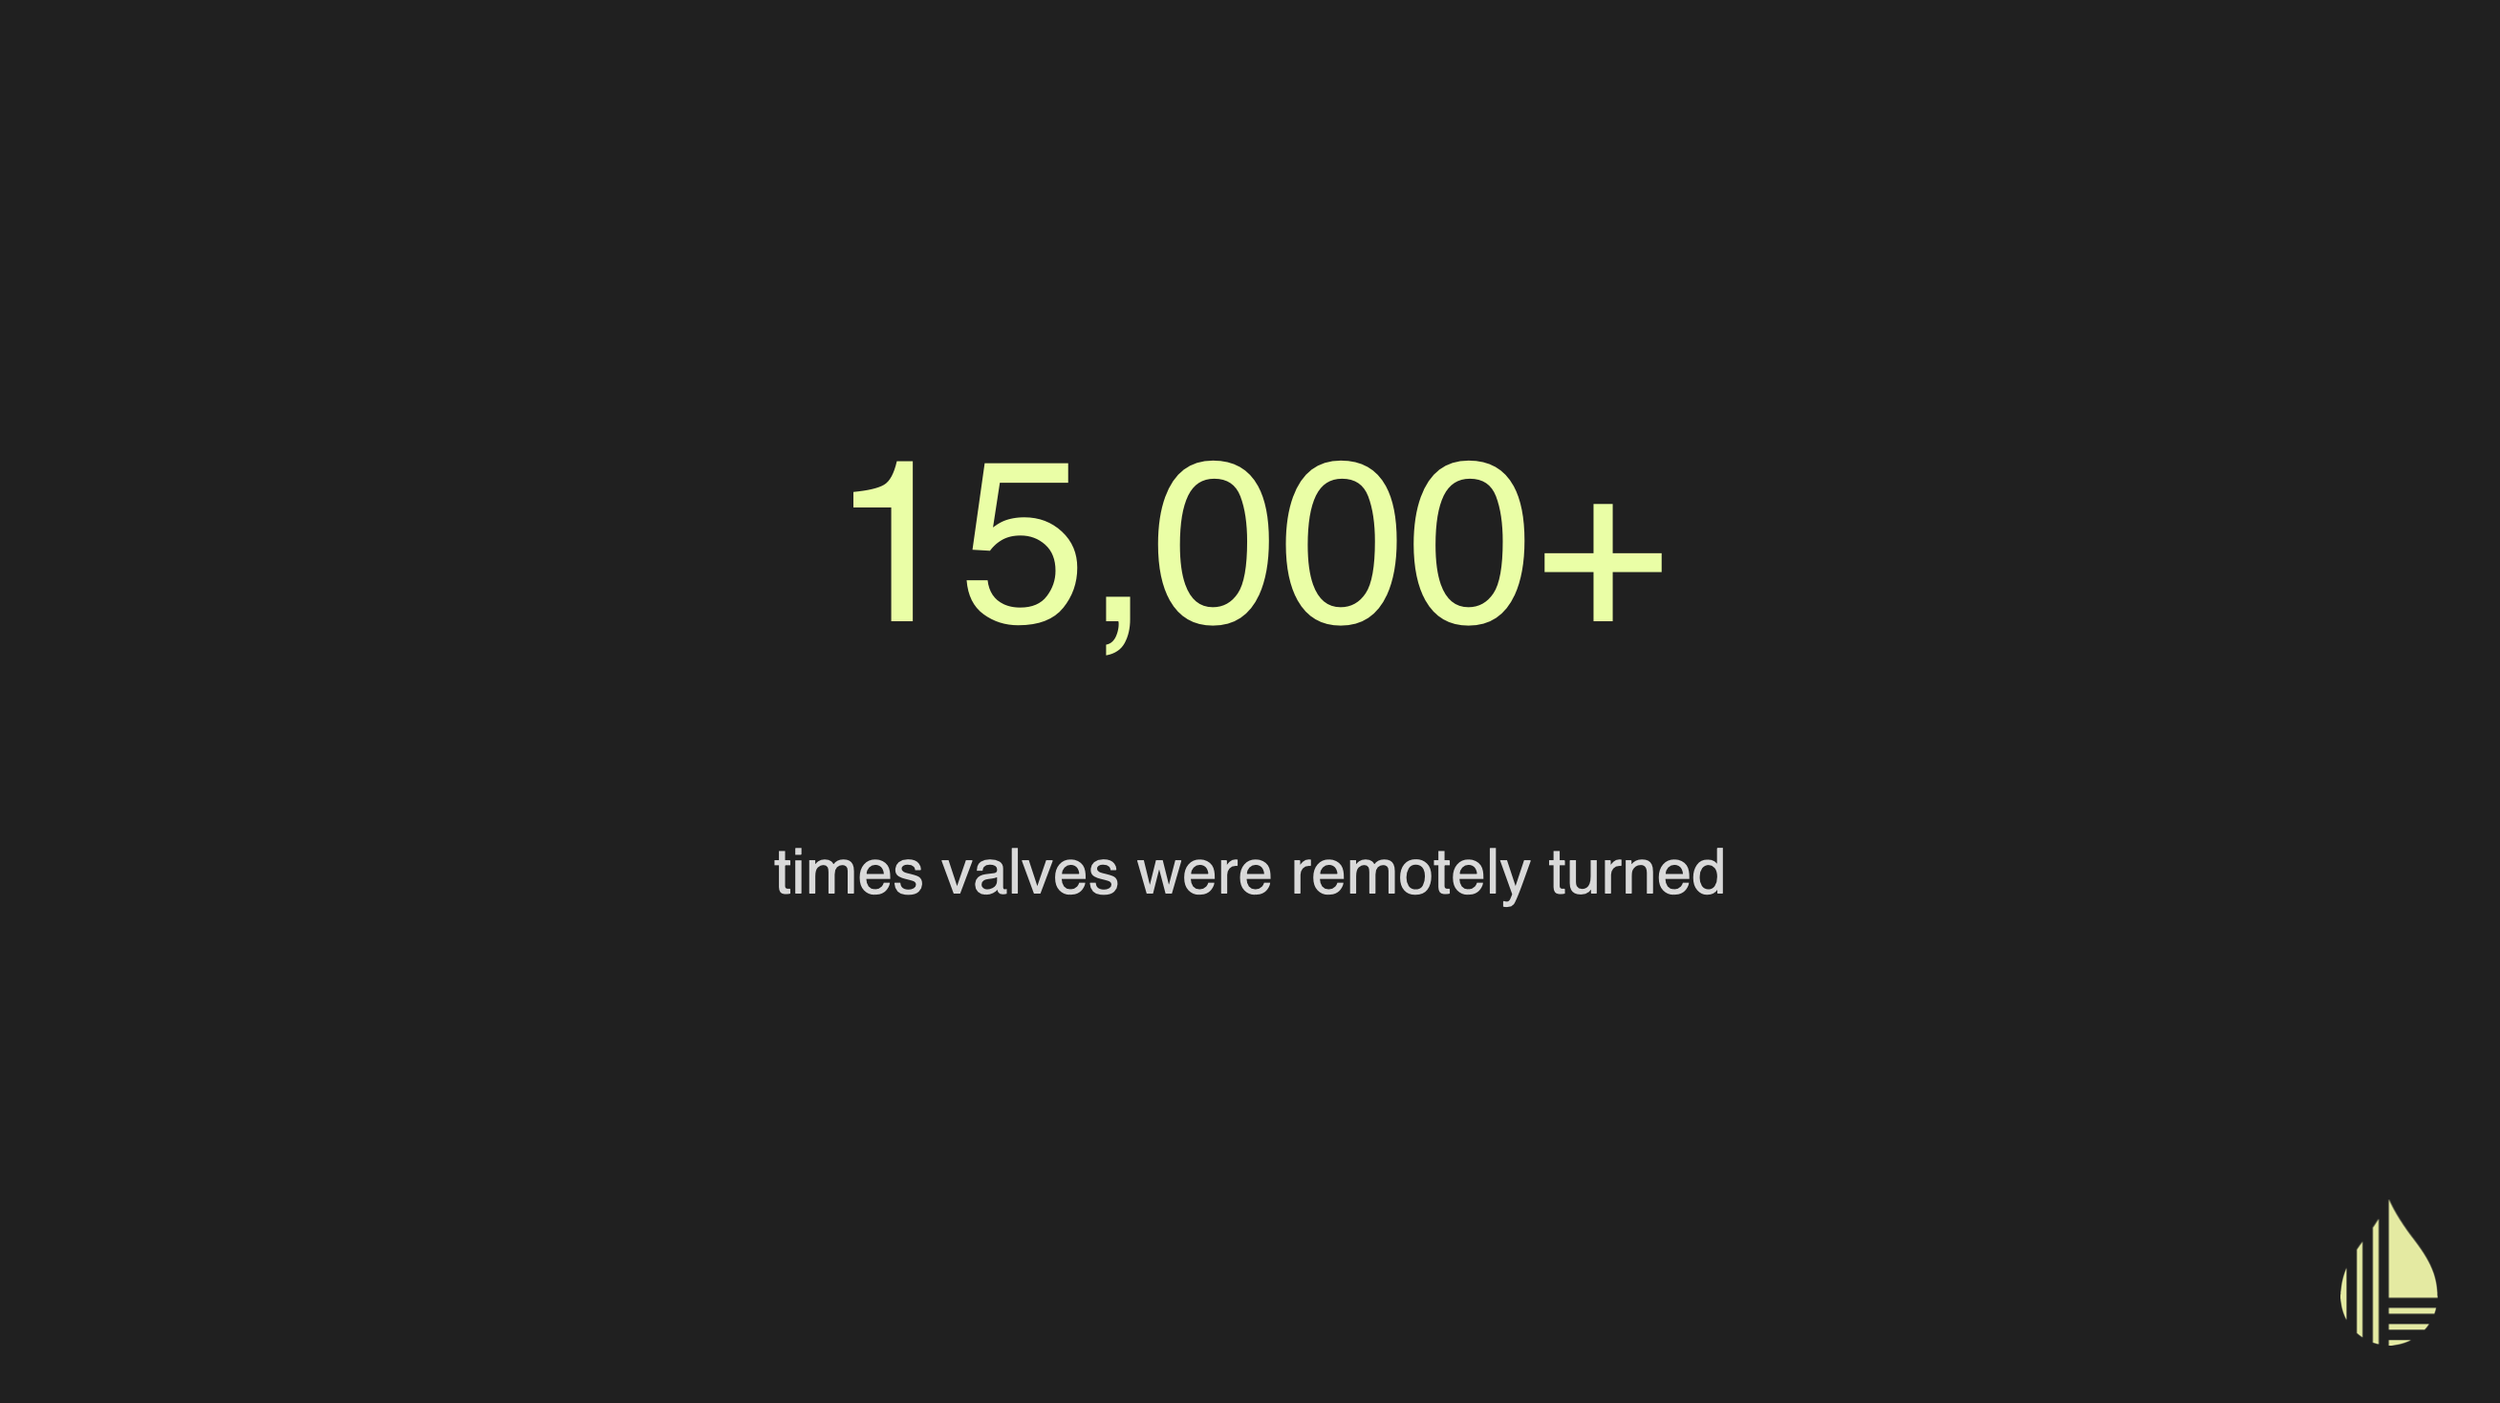
Platform-wide — Contributed to a product delivering 75M+ gallons of precisely managed water and 15,000+ remote valve operations in 2024